

Making Data Work for Your Goals
This blog is about data analysis – but please don’t close your browser! I promise this post will make you think differently about what you can do to make data work for you.
I am a self-confessed Speechie data nerd. I love looking at and comparing data… but I know not everyone shares my excitement for data. In fact, I think for a lot of Speech Pathologists, it is one of the least enjoyable tasks of the job. However, it is a necessary evil, especially when doing AAC device trials. How else can we definitively know which device is the best fit for our clients?
Recently, the Liberator Consultant group was able to meet with Russel Cross, co-creator of the Realize language program, who blew our minds with what information he was able to extract from his data sets.
I often discuss using data sets to compare different devices with therapists that I’m supporting through trials, so I thought I would share some of my tips in this blog, to show you some data in action.
So, for the purposes of this, I’m going to compare 2 language systems across a couple of measures. Both Wordpower 80 and LAMP WFL 84 are popular vocabularies that have a similar number of cells per page, however they use completely different language representation methods to display language. Let’s look at how they compare across 3 different measures.
- ‘Speaking Rate’ (speed)
I’m going to analyse the following target phrases to compare how long they take to generate in each vocabulary.
“I like to drink coffee”
“I want to go home”
“My name is Freya”
“I think there’s something funny going on here”
“I need to eat a cookie”
I started by generating the target sentences in each vocabulary, and then extracting the data from Realize Language into Excel to give me a time stamp for each phrase. You can see this summarised in the table below.
|
Sentence |
Time (seconds) Wordpower 80 |
Time (seconds) LAMP WFL 84 |
Difference (seconds) |
|
I like to drink coffee |
0:00:13
|
0:00:10
|
0:00:03 |
|
I want to go home |
0:00:17
|
0:00:15
|
0:00:02 |
|
My name is Freya |
0:00:58
|
0:00:16
|
0:00:42 |
|
I think there is something funny going on here |
0:03:11
|
0:02:17
|
0:01:06 |
|
I need to eat a cookie |
0:00:28
|
0:00:11
|
0:00:17 |
Once I copied the data from Realize into an Excel spreadsheet, I was able to use Excel to work out the time differences for me by using a simple SUM equation. The rate is simply the final time stamp, minus the first time stamp to give me the length of time it took me to generate that sentence.
|
13:38:57 |
I |
|
13:38:59 |
like |
|
13:39:02 |
to |
|
13:39:04 |
drink |
|
13:39:10 |
coffee |
|
0:00:13 |
You can see that there is a subtle difference in the time it took me to generate sentences between the two systems. You can also see at a glance that for me, LAMP WFL is a ‘faster’ way for me to generate language. Of course, this is just an example of how you could use this measurement, but it could be a nice way to quantify a difference between 2 systems within a funding report when justifying one system over another.
- Type Token Ratio (richness)
Type Token Ratio (TTR) is a measure of lexical variation; that is, how much diversity there is in the number of different words within the overall number of total words.
To calculate the TTR we take the total number of UNIQUE words (types) divided by the total number of words (tokens) in each segment of language. The closer the TTR ratio is to 1, the greater the lexical richness of the segment).
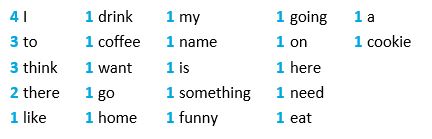
There is a word lists analysis tool in Realize Language which I used to help me calculate the TTR for my sample. For this example, my TTR is the same for both systems because I used the same target sentences.
|
22 different words (Type) |
|
|
30 total occurrences (Token) |
|
|
TTR (22/30) = 0.73 |
|
|
|
|
If you were comparing someone’s overall use of a system over time, this can be an especially useful measure to take to show a growing vocabulary of words over time. When the type measure increases, you can make comment about how your client is using more unique words in their system/that they have learnt new vocabulary. Or if your client has a goal around increasing the use of their device, you may see this represented within the token measure, as the number of overall words they are using will increase as their use increases. If you have a goal around increasing vocabulary/sentence length, this will also show up in a TTR measure.
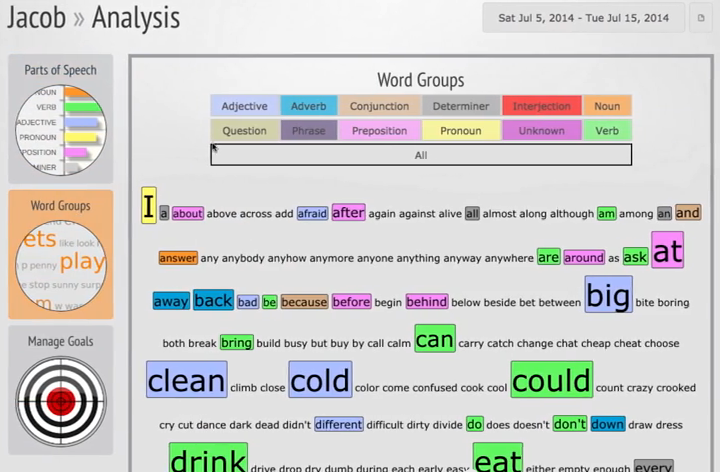
Here is an extract from the Realize Language ‘Words’ list for one of my data sets. You can see how this gives me the total number of words, as well as the instances of each word.
- General Analysis – (Sentence Generation).
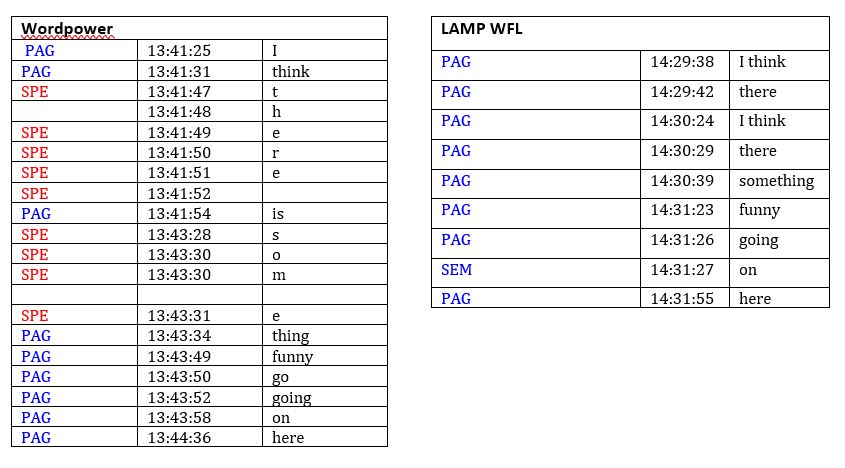
As well as looking at the speed of sentence creation, we can also look at how a sentence is created. Below, I’ve used the Realize Language Log analysis to see how each sentence was created.
This basic detail allows us to see what our client is doing. In the example, you can see that I used the spelling page to access the word ‘there’ in the Wordpower file. However, in the LAMP WFL file I was able to access the word through a sequence. Similarly, the word ‘some’ was spelt in the WordPower file as I couldn’t find the vocabulary I needed quickly, however in LAMP WFL I did not need to access the spelling page to find the vocabulary. This is a really nice visual way to show how someone is accessing language across different systems, and therefore be able to decide which vocabulary best suits their needs.
These are just a couple of examples of how Realize Language can really help you break down exactly how your client is using their device to access and develop language. There are so many ways you can make your client’s data log work for you – don’t be scared of the data, learn to use it to your advantage. As always, please contact your local Liberator Consultant if you’d like some training in this area.